Saturday 30 August 2014

Low Power Techniques : Clock Gating

Disclaimer : All the articles are written with an assumption that the reader has a basic knowledge of Boolean Gates and digital elements.

In this article, the key focus of discussion would be clock gating and its impact on the design on modern day SoCs. Clocks could be considered as the Arteries (or Veins so for the matter) of the entire SoC and clock source being the heart of any SoC. All the IP’s like CPU, Audio, Display, USB, etc require a clock to function. It is the “CLOCK” which gets to decide the maximum speed of operation for any SoC (Here I am not considering the throughput increase due to the various kinds of architectures employed in designing the SoC) and hence special attention should be given to this signal.

Another reason why this signal should be given more attention is due the fact that it is the highest toggling signal in any SoC and therefore consumes the largest fraction of entire SoC power. In a typical SoC for mobile application, the clock tree consumes 30-40% of the power (Yes, this number can be more depending on the Clocking architecture employed).

Clock gating is a technique to turn the clock OFF depending on the requirement or the use case. How this is achieved is the main focus of this topic.


There are essentially two ways to gate the clock. One through hardware control and one through software control.

The software control is through registers which are used to control the PLL or DLL or any other clock source that we may have. We turn the PLL/DLL/Source off (which is in itself at times a complex process) by following a specific sequence. Turning of the source is a method to gate the trunk of the clock tree (I’ll talk about the Industry lingo on clocks in an upcoming article. Kindly bear with us on terms like trunk, branch, etc).
It may happen that in some of the cases we want to shut only a branch of the trunk. This is the point where hardware control comes in picture.

This article (and some subsequent articles) will discuss on hardware control of the clock.

Below is shown a free running clock :


Fig 1. Free Running Clock
---------------------------------------------------------------------------------------
How can we actually stop it based on some control signal say “enable”?
---------------------------------------------------------------------------------------

Yes, you got it right, we need to AND the two signals and put the enable to be at “1” when we need the clock and “0” when we don’t want the clock output for any IP.
The figure below shows a simple AND gate being used as a gate.


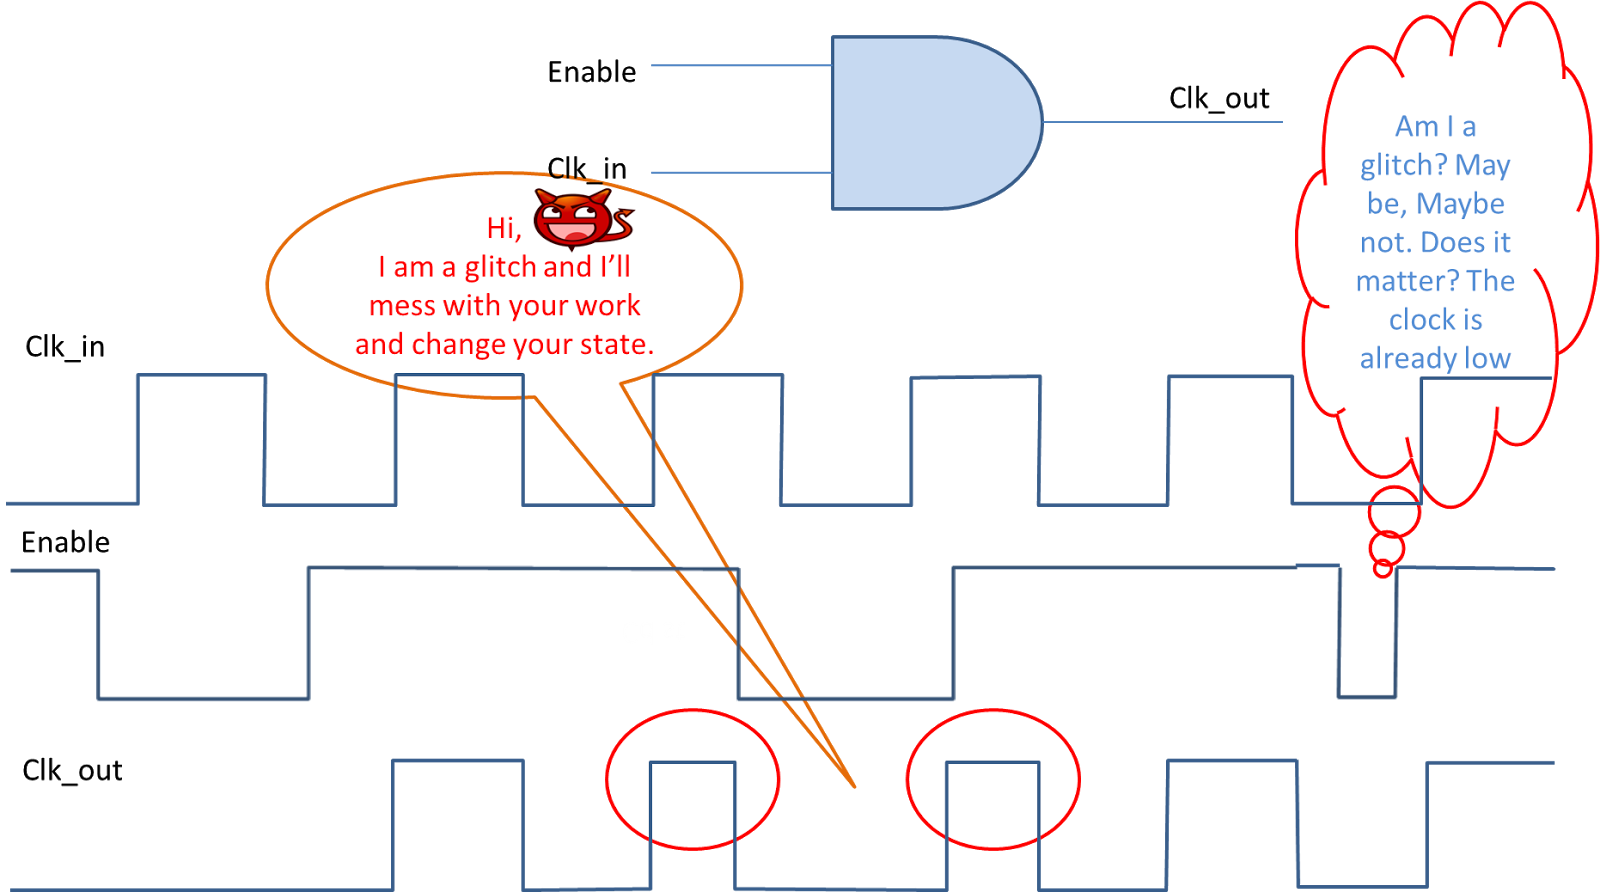
                                       Fig 2. AND Gate as a Clock Gate and Problem of Glitch

So do we actually use this “AND” gate in our SoCs to gate the clock from reaching to any IP?

You guessed it right. No, this is not the standard cell which any modern day SoC use. The reason is clear from above figure itself. If the enable signal changes while the clock is high, this will lead to a runt pulse termed as “Glitch”. A glitch is harmful for any SoC as it can lead to unknown states or the states which we don’t want our system to be in. For now, I’ll leave the glitch to a-not-so-far-in future article.

I’ll discuss about “Clock Gating Cell” in the next article.


Till then, Enjoy!!! 

SESSION 3: Reading from FG-MOSFETs: Part- 1

Hello everyone. In previous sessions, we have discussed the method to program and erase an FG-MOSFET. 

And programmed state corresponds to binary 0, whereas erased state corresponds to binary 1.

Now the question here lies: how will you get to know whether your FG-MOSFET has a binary '0' or a binary '1' stored in it? In other words, how will you read the data present in FG-MOSFET?

------------------------------------------------------------
The answer lies in the threshold voltage.
------------------------------------------------------------

Now suppose I connect an FG-MOSFET to two batteries, one VGS between gate and source, and the other VDS between drain and source. See the figure below.


So the voltage VGS provides an electric field in the direction shown by the red arrows in the figure below:

Because of this electric field, the holes at the interface of p-type semiconductor and oxide layer are repelled away. The electrons appear at this interface from bulk of p-type semiconductor, thus forming an n-type channel between n-type source and n-type drain. Since this n-type channel is formed from p-type semiconductor, it's called inversion channel.

What role does VDS play here? It provides the field from Drain to Source, thus pulling electrons from Source to Drain via the inversion channel formed by applying VGS

You may visualize the above process in the video below. The small red circles represent the holes in p-type semiconductor and the small green circles represent the electrons. Note the inversion channel formation in the video.


In the above video, the flow of electrons indicates the flow of current in external circuit. 
Now, what if the voltage VGS  was not sufficient enough to create the inversion channel? Then obviously, current will not be able to flow.So for every FG-MOSFET, there is a particular value of VGS, only above which the inversion channel is formed and conduction takes place. This value is called threshold voltage, VT.

So, the conclusion till now is: 

The following graph represents the above relation between current IDS and VGS:


As we might intuitively conclude that increasing VDS shall also increase the current IDS (the greater the VDS, greater the pull on electrons via the channel), but does it go on forever?
Reason: Channel pinch-off

Let us see what is channel pinch-off and why does it occur in the next part of this session.
Eventually you will see these concepts clubbing together to build up the concept of reading from an FG-MOSFET.


Till then : "Thresholds are not the ends! Something definitely lies beyond them"


Sunday 17 August 2014

The Myth of Area Downsizing in SoCs

Why do we fuss so much about optimizing the area?

Why do we want to optimize the design and learn various design techniques which help in reducing the area to obtain the same functionality?

This is the topic of discussion for this article.

Any chip is fabricated by following a series of steps like lithography, oxidation, etching, metal disposition, ion implantation, etc. These steps are performed on a silicon wafer (which is generally circular owing to the processes that we use to obtain pure silicon which leads to long cylinder of wafers (called Silicon Ingots) which is then sliced to obtain the silicon wafer). A single wafer can contain many dies (which we package and obtain our chips from).
A diagram is shown below which shows the wafer (sliced from the cylinder) and the dies in the wafer:
Fig 1. Silicon Wafer and Ingot,  1a. A Wafer depicting dies ,
1b. A cylindrical silicon ingot which is sliced to get various wafers
Fig 2. Silicon wafers with different die size and defects

Note that it is these dies which we package and obtain our chips from. You can view the actual Silicon Ingot at this link: Making of Silicon Ingots

From figure 1 and figure 2 it is clear that if we want more chips from a wafer we need to have a small die size or in other words we can say that,
                                         “Yield has an inverse relationship with die size”.
The more the die size, lesser is the yield for the wafer with same sizes.
Another thing to note is that if we keep the die size to be constant then in order to increase the yield we will have to increase the wafer size.

So do we increase the wafer size to obtain higher yield if we can’t reduce the area further?
The answer is partly yes.

We cannot increase the wafer size indefinitely as it gets unstable after certain size. Currently the semiconductor industry has been able to hit wafer sizes 6 inch, 12 inch and 18 inch. Plenty of research is going on for increasing the wafer size.
Another thing which I have not mentioned above in regards to yield is that having a lesser area has other perks as well. The above mentioned processes like lithography, ion implantation, etc are not perfect and they introduce defects in the chip leading to faulty chips and thereby lesser yield.

How does having a lesser area helps?

It is said a picture is worth thousand words. So considering Fig 2., it is obvious that having a lesser die area will definitely contribute to higher yield considering that the process introduced defects(In Fig 2. above, the red dots corresponds to defective dies) are similar. If we calculate the yields from Fig 2. , it is clear that in 1st wafer the yield would be 2/4 = 0.5 or 50% (I have ignored the area which is not used in any die, the blue part, just so to be abstract) and in 2nd wafer it would be 22/28 = 0.78 or 78%.
Clearly the yield is greater in 2nd wafer.

So the next time you hear people trying to reduce the area, you will definitely have some idea on why the area reduction is important for any SoC or ASIC.

Till then "Try to learn something about everything and everything about something - Thomas Huxley".

Feedback and comments are welcome.

Monday 11 August 2014

SESSION 2: Tunneling for Programming and Erasing FG-MOSFETs

As discussed in the last session, we shall see how tunneling is responsible for programming and erasing FG-MOSFETs.

We discussed in the previous session about the 2 states of the FG-MOSFET:

  1. Binary 0 : Programmed => Electrons present in Floating Gate
  2. Binary 1 : Erased => Electrons removed from Floating Gate


Following is the diagram of FG-MOSFET which we analyzed in the last session:


When we program the device (20 V at Control Gate and 0 V at Substrate), because of the downward electric field, the electrons are tunneled upwards through the Lower Oxide Layer into the Floating Gate. In the figure below, the black arrows downward denote the applied electric field through voltage on Control Gate. The read arrows upward show the direction of  movement of bulk electrons from the p-type substrate.


So what actually happens at the p-type substrate -TO- oxide - TO- Floating Gate interfaces which causes electrons to even cross the oxide layer in between?

 I hope you are familiar with the energy diagrams. Below you can see the energy diagram of the above mentioned interface at equilibrium.


The following notations are used in the diagram:


The following layers of the FG-MOSFET are shown in the diagram:
  1. n+ type Control Gate : made of n+ type Polysilicon
  2. Upper Oxide Layer: made of silicon dioxide or oxide-nitride-oxide (ONO)
  3. n+ type Floating Gate : again made of n+ type Polysilicon
  4. Lower Oxide Layer: made of silicon dioxide
  5. p type Semiconductor
So, when a high voltage, say 20 V is applied to the Control Gate, the energy bands transform as shown in the figure below:


Now, here comes trick! I guess you must have noticed the very less thickness of Lower Oxide Layer as compared to Upper Oxide Layer. The high voltage (20 V) causes a huge drop of Fermi Level of the Floating Gate, as a result of which, the potential barrier width that an electron has to cross reduces (Note the triangular barrier developed adjoining the conduction band of p-type semiconductor). On the other hand, there is not much bending of barrier in the Upper Oxide Layer because of its thickness. So the thin potential barrier in the Lower Oxide Layer provides a path for electrons to tunnel through it. And consequently, the electrons get trapped in the Floating Gate.

This tunneling in FG-MOSFETs is called Fowler-Nordheim Tunneling (F-N Tunneling).

After going through lot of mathematical manipulations and assumptions, we obtain the following relation for tunneling probability of an electron for F-N Tunneling:


The probability equation above is a negative exponential curve [ f(x) = exp(-x) ] like below (shown for x > 0):


So, the probability that a particle can tunnel through the potential barrier increases as x decreases and gets closer to x = 0.
In our tunneling equation, the probability will hence increase if the whole factor

reduces to a very small value. This is achieved by applying a high voltage (20 V) and hence a high electric field E. Hence, by applying this high electric field, we actually increase the probability of tunneling of an electron into the Floating Gate, hence causing the program operation to happen.
Another conclusion : a small voltage ideally cannot disturb the electrons inside the Floating Gate as a small electric field cannot increase the probability of tunneling of an electron. 


I guess you have a brief idea now as to how the tunneling causes the program operation in FG-MOSFETs to happen. It is easy to deduce the band diagrams in erase operation: the bending of oxide layers happens just the reverse and electron crosses from Floating Gate to the Semiconductor.

Now, how will you detect whether there are electrons or not in the Floating Gate? In other words, how  will you read whether the FG-MOSFET contains a binary 0 (programmed)  or binary 1 (erased)? 

So, let us discuss the Read operation in FG-MOSFET in the next session, now that we have completed Program and Erase operations.


Till then, "Anyone who is not shocked by the quantum theory has not understood it"   ---- Niels Bohr.


Sunday 10 August 2014

Quiz #1 Switching Activity Calculation for N input gates

This is one of the “many to follow” quizzes and it is taken from Digital Integrated Circuits by Jan M. Rabaey, et al. (One of the best books in the world for learning about the Digital Integrated Circuits). Soon we will have real life circuits(Which are heavily used in the semiconductor industry) to analyze in the quiz section. 

Switching Activity
 We all know that the dynamic power dissipation in is given as :
P(dynamic) = α0->1CLVDD2f
Here the factor α0->1 is termed as switching activity (or the transition activity). The transition activity is a strong function of logic function (the logic operation being performed by any of the digital gates like AND, OR, NAND, etc). For gates implemented using static CMOS technology, this factor is a multiplication of the two probabilities (The subscript 0->1 is there as for static CMOS gates  power is only consumed when the output switches from 0 to 1 and not other way round as we have a direct path from supply to the output when output transitions from 0 to 1. More to follow on this in the device section):

P0: The probability that the output will be “0” in present cycle (or for the matter in any cycle)
P1: The probability that the output will be “1” in the next cycle (or for the matter subsequent cycle of the cycle under consideration).

So α0->1 = P0*P1 or in other words
α0->1 = P0*(1-P0)

If we assume that the inputs to the N input gates are not related to each other (which is a practical consideration) and are distributed uniformly over time, then the switching activity is given as :

α0->1 = (N0/2N)* (N1/2N)= N0(2N – N0)/22N

N0: It is the number of “0” entries in the output column of truth table for that gate
N1: It is the number of “1” entries in the output column of the truth table for the same gate

Now for the problem; suppose we have N input XOR, NOR and NAND gates. Assuming the above assumptions to be valid what should be the switching activity for the above gates? What will be the probability if we replace the N input gates with an inverter?

                                                                   Fig 1. N input NAND Gate
The answers to above questions are simple and easier to find with the above mentioned details.

Feel free to comment and discuss on the same.

Comments and Feedback are welcome.

Resets - II

Continuing from our last article, Resets - I , this article discusses the synchronous resets mentioned earlier and evaluates its pros and cons.

Before continuing forward, a basic knowledge of the "Flip Flop" is assumed.

Synchronous Resets

Synchronous is derived from two terms “syn” meaning “same” + “chronos” meaning “time” and how do we denote time in our systems? The answer is Clocks. So going by the name, this reset occurs when the reset is HIGH/LOW (depending on the type of reset) at a rising/falling clock edge (again depending on whether the flop is positive edge triggered or negative edge triggered). If the reset goes high (Assuming reset=1 put Q=0) in between any time t, t+T (where T is the time period of the clock) and comes back to “0”, the reset will not be registered. Or in other words there is no difference between the D signal (Assuming a D type flop which is the industry standard) and the reset signal as both of the signals are sampled at the positive/negative edge of the clock.
Consider the diagrams below and it will make more sense:


Fig 1. D Flip Flop


                                              Fig 2. Timing Diagram for D Flip Flop in fig1.
Note that in above diagram we have assumed a Zero delay model for each of the signals (Which is a deviation from the real world as it has delays, I will come back with more on this)
From above diagram it is easier to see that No matter what the value of D_flop (which is the D input of the flop ) while the sync_reset is high, the Q_flop will be "0". Once the reset has been removed, Q_flop follows the D_flop.

The plus points of the synchronous reset are clearly visible:
1.      It helps in glitch filtering (If they do not occur near the clock edge then the glitch will not cause any harm to the circuit).
2.      Also the (not so visible point) is that the flop circuit is simple and hence consumes less area.
3.      The resulting system is completely synchronous

The negative point lies in the plus point themselves:

1.      It requires a clock in order to be sampled.
2.    The applied reset will have to strictly adhere to the requirements of setup and hold times (provided in the “SPEC” sheet of the Flop) so that there are no timing issues.
3.     One big problem which arises while using this kind of reset (because of the fact that they are similar to data signals) is the synthesis. The synthesis tool may not be able to differentiate between data and the reset as both are being sampled on the clock edge. It becomes necessary then to tell the tool to add certain “directives” which tell it that the input to “S or R” pin of the flop is a “set or reset” signal.
4.   Also it may happen that the reset signal becomes the fastest timing path and then would need a timing closure  as it would be the critical path, which we generally don’t want. 

Synchronous designs have been the preferred design for designers for the last few decades but with increasing 
complexity newer approaches are being adopted by the industry (GALS being one of them which I mentioned in
an earlier post).

Hope you liked the article.

Your feedback and comments are welcome.

Upcoming Post : Reset - III


Monday 4 August 2014

SESSION 1: Basic Storage Unit in Flash Memories

Most of us use flash memories today in n-number of devices, for example, SSDs, eMMC, SD cards, USB pen-drives, etc. The list is expanding day by day as we need a substitute for the mechanical and heat-plus-noise producing Hard Disk Drives (HDDs). 

I would like to specify that this article assumes a coneptual knowledge of MOSFETs and their working. If you are not familiar with it you can visit this article : Basics of MOS Devices

In this first session of Flash Memories, let us start from the unit cell of storage, that is, the particular electronic component that stores a bit of data. And that component is Floating Gate MOSFETs (FG-MOSFETs). Though I think I need not expand MOSFETs (Metal-Oxide-Semiconductor Field Effect Transistors), yet it would prove beneficial later!

So, this is what a traditional MOSFET looks like:


n-type MOSFET

The MOSFET has a METAL contact attached to the conducting polysilicon layer. Below the polysilicon layer is the insulating OXIDE layer followed by the SEMICONDUCTOR.

And this is how our FG-MOSFET looks like:
n-type FG-MOSFET


As clearly distinguishable from the image above, the FG-MOSFET has an additional oxide layer and a Floating Gate sandwiched between the two oxide layers. If somehow, a couple of electrons get trapped in this floating gate, ideally they won't be able to leak out even if the power to this device is turned off, thanks to the oxide layers on both sides. This electron trapping in the floating gate forms the basic concept of non-volatile storage using FG-MOSFETs.

So, for the very basic understanding, FG-MOSFETs can have one of the following two states:

1. Electrons are trapped in Floating Gate       : Programmed State, equivalent to BINARY STATE '0'.
2. Electrons are not present in Floating Gate  : Erased State, equivalent to BINARY STATE '1'.

Hence, if you are programming an FG-MOSFET, you are basically pumping electrons into the floating gate. And if you are erasing an FG-MOSFET, you are pulling out the electrons from the floating gate, obviously if the electrons are present. 

But the question now arises: How can you pump electrons into the floating gate with the insulating oxide layers surrounding it? Similarly how can you erase/remove the electrons from the floating gate? 

The answer lies in the keyword : tunneling.

Hence, if we apply a huge voltage (say 20 V) on the control gate and 0V (GND) at the substrate, the electrons present in the bulk in p-type semiconductor will tunnel into the oxide and get trapped in the floating gate. See the video below: 


Similarly, if we want to erase the device, we just reverse the voltages, that is, 20 V at substrate and GND on Control Gate. See the video below:


I guess the term tunneling must be familiar with you, but let us discuss this concept in a bit more detail in the next section. After that, we can be clear about program and erase in an FG-MOSFET!

Till then, "be constantly amazed with electrons!"


Sunday 3 August 2014

Noise and Jitter

In this article I will talk about the relation between noise (by Noise here I typically refer to Ground or Power Supply variations) and jitter.
Consider the diagram shown below which shows a variation in VDD/GND rail. Let us say that the maximum variation (end to end) that occurs in the PWR or GND rail is X. This variation has a relation with the clock transitions that occur in the clock buffer used for distribution. Or in other words the variation X directly translates in the form of jitter in the Clock Distribution Buffer.
                                                             Fig 1. Noise in PWR/GND Rail 
Because of above variation in the rail, the transition time for a clock buffer changes which lead not only to more power consumption (How? Can you answer? I will discuss this in some other article but for now we can live with the fact that lower transition rate leads to higher power consumption) but also to jitter. The diagram below shows how such a thing happens:
                                                  Fig 2. Noise to Jitter Translation in Clock Buffer
The region Y above (which typically in a chip denotes the time difference between the 90% of clock high voltage level and 10% of clock high voltage level and can be put into memory as a rule of thumb) is the region where threshold transition of the logic level happens(region Z). Transition in logic level refers to change in logical “0” to logical “1”. This region is directly dependent on the X. The more the X, the greater will be the value of Y and this will lead to more power consumption. In short Jitter has a relation with Noise which can be described as:
Y (Jitter) = X(Noise) * dt/dV
where dt/dV is the inverse of slew rate for the clock.
Note that it is X that adds randomness to the jitter phenomenon.
In short in order to have low jitter it is necessary to control GND/VDD Bounce. These variation lead to other issues which I will cover in some future topic.


Feedback and comments are welcome.

Upcoming Post :  Synchronous and Asynchronous Reset